Complex Fluid Dynamics
Butler Research Group


electrophoretic motion
convective flow
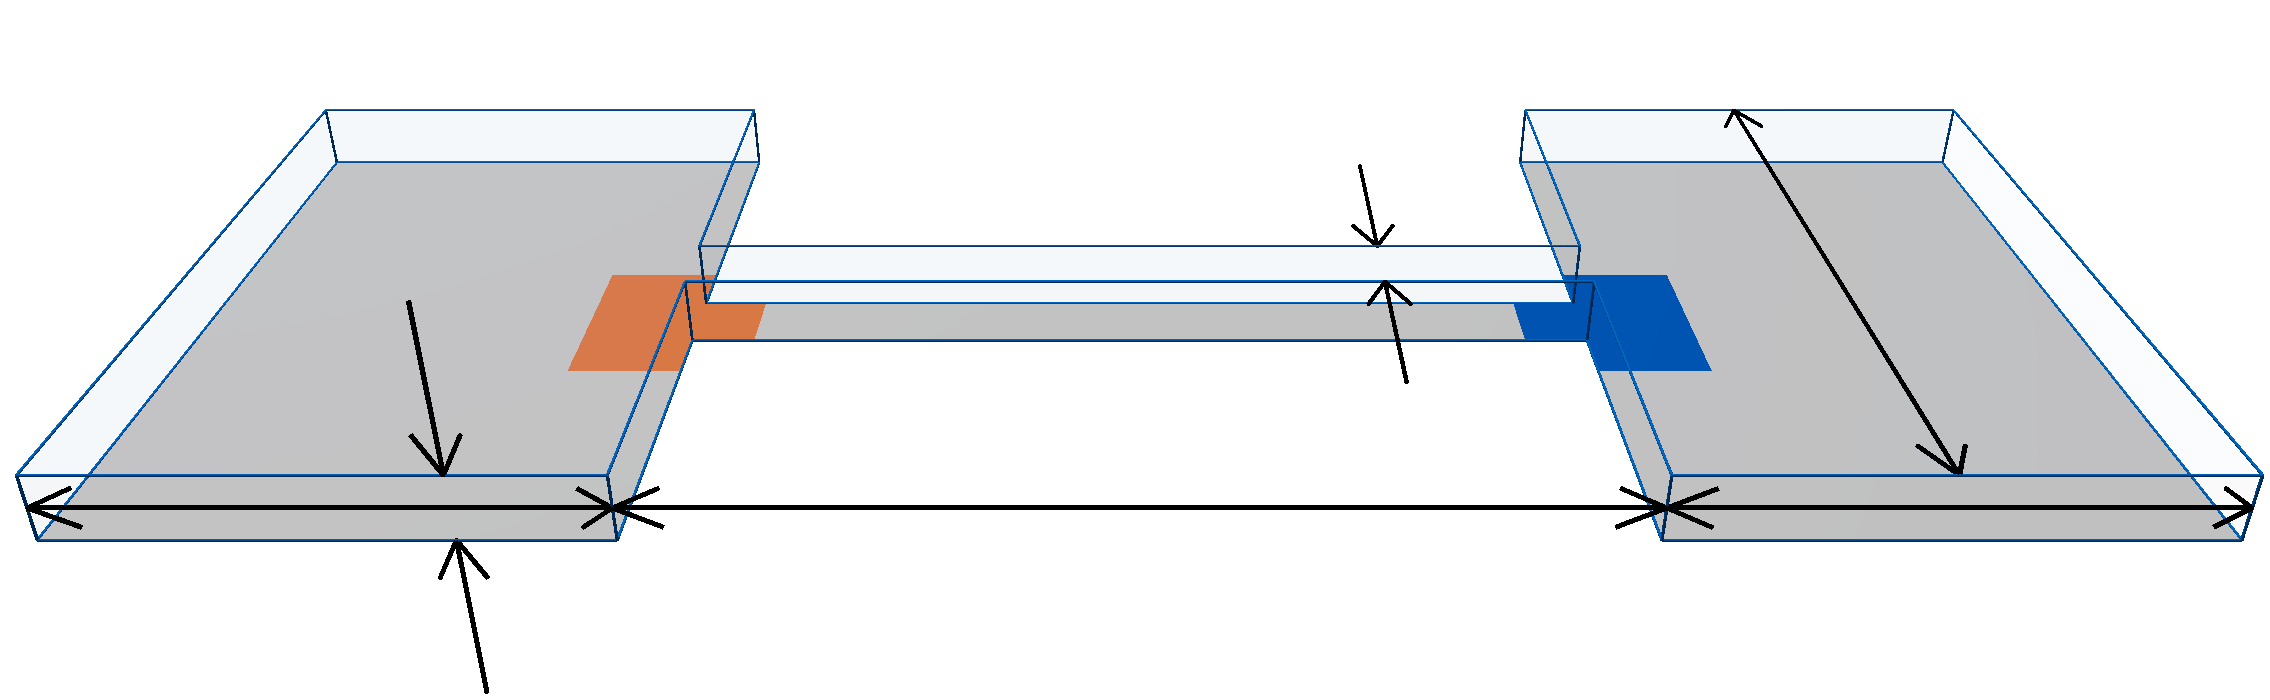
18 mm
10 mm
10 mm
0.1 mm
0.1 mm
1 mm
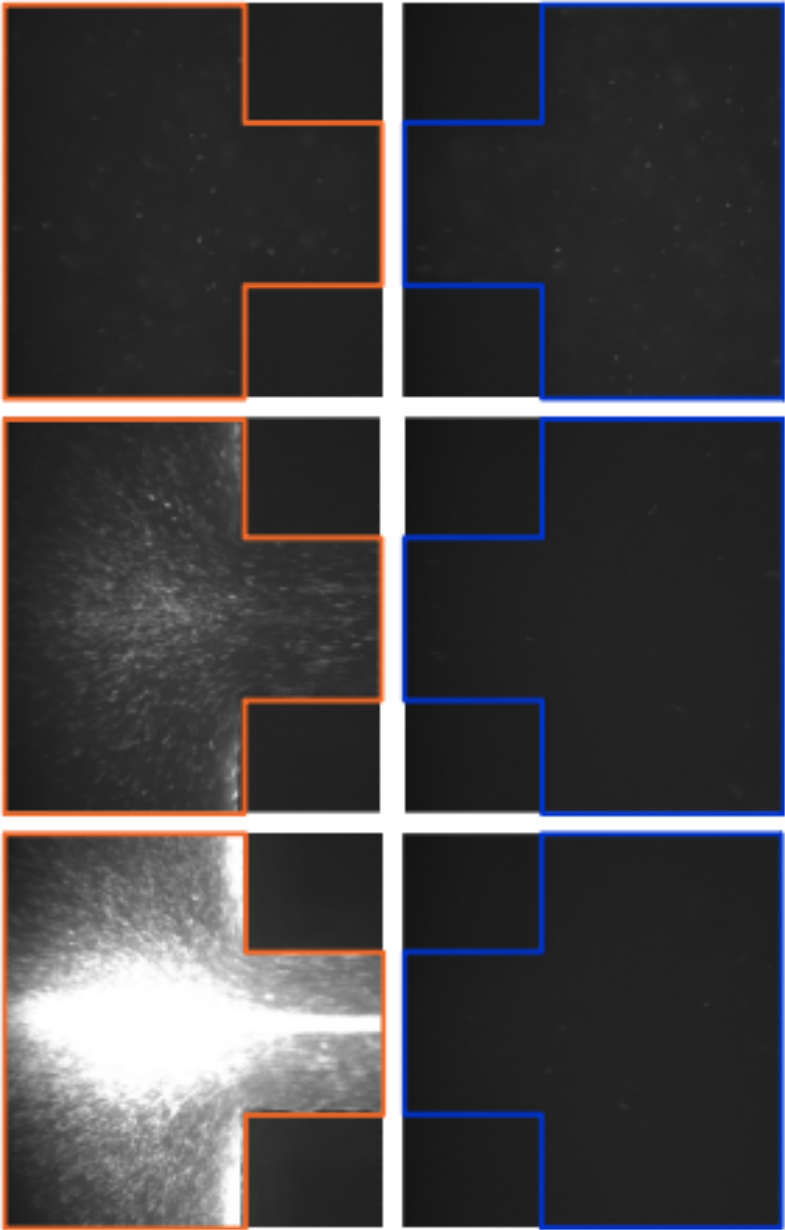
t = 0 min
t = 1 min
t = 5 min
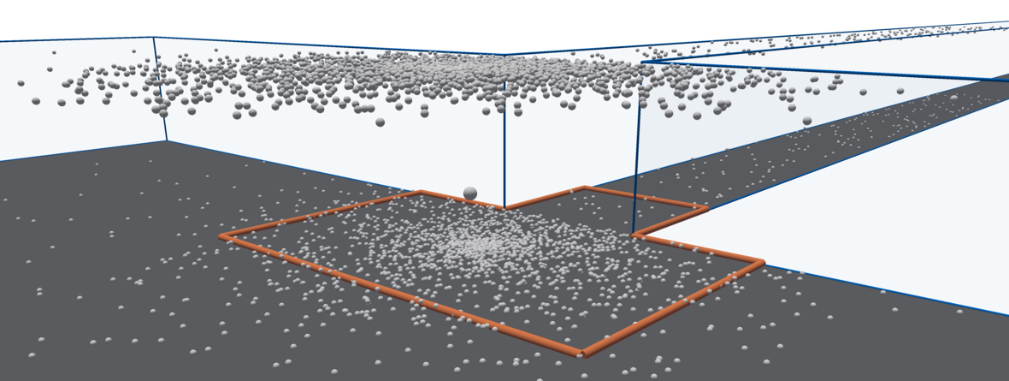
A parallel convective flow and electric field can be used to concentrate long, flexible strands of DNA at the entry of a microchannel (orange region, top right). Sequential images of the entry regions (orange outline, far left) show the concentration build-up; at the channel exit (blue outline/region), measurements indicate that few, if any, DNA molecules escape the channel during the course of the five-minute experiment. The enhancement of DNA concentration occurs within a thin layer near the wall at the entry of the channel, as illustrated (bottom right) and as confirmed by confocal microscopy measurements.
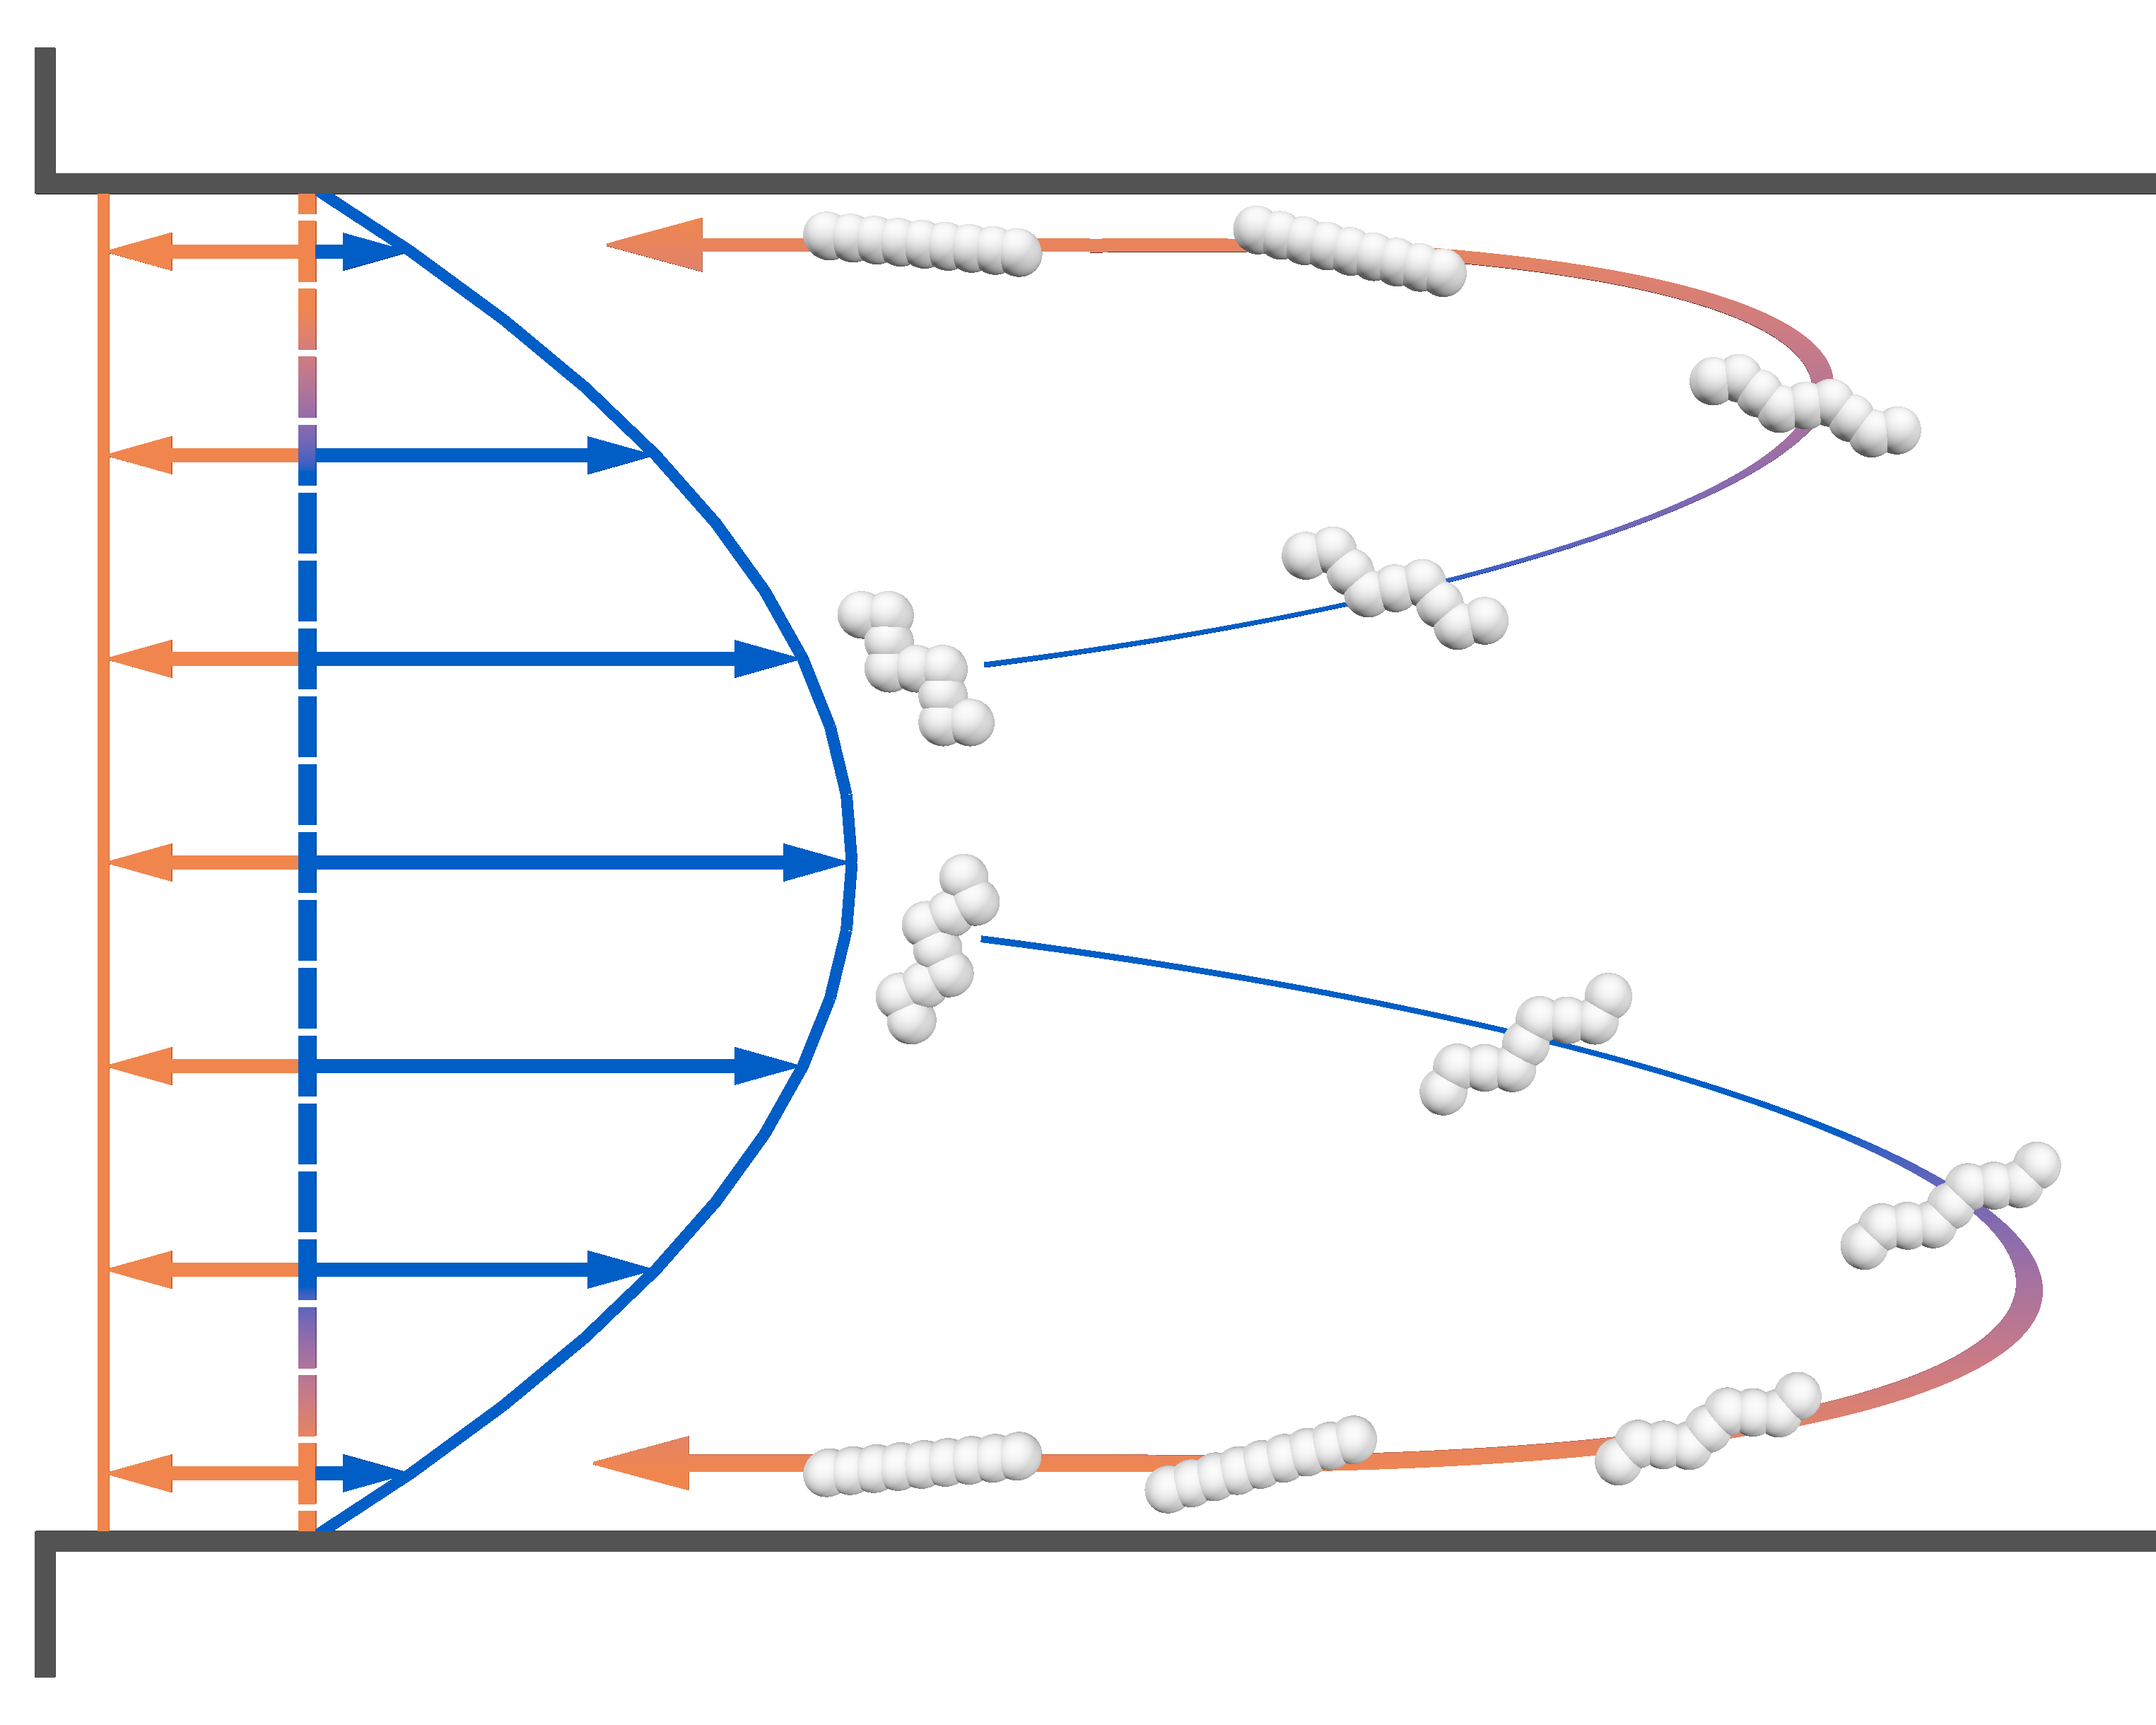
A sketch explaining the concentration process is shown on the left. DNA molecules (white) enter the microfluidic channel due to the large convective flow (blue). The electric field applied along the channel axis induces a small, opposing electrophoretic velocity (orange). Experimental observations indicate that the DNA migrates toward the bounding walls in response to the simultaneous application of the flow and electric field; migration is not observed when either field is applied alone (click here for more information). The DNA molecules return toward the inlet (blue-orange arrows), once sufficiently near the wall where the electrophoretic velocity exceeds the fluid velocity.
The video shows the trapping of DNA at the inlet to the channel. The DNA can be seen moving out of the channel since the microscope is focused on the near-wall region; the strong convective flow of DNA into the channel is not seen in the field of view. Also, the fluorescent labels on the DNA are being continuously photobleached while the trapping occurs, hence the concentration of DNA is higher than it appears in the video.
Relevant Publications:
